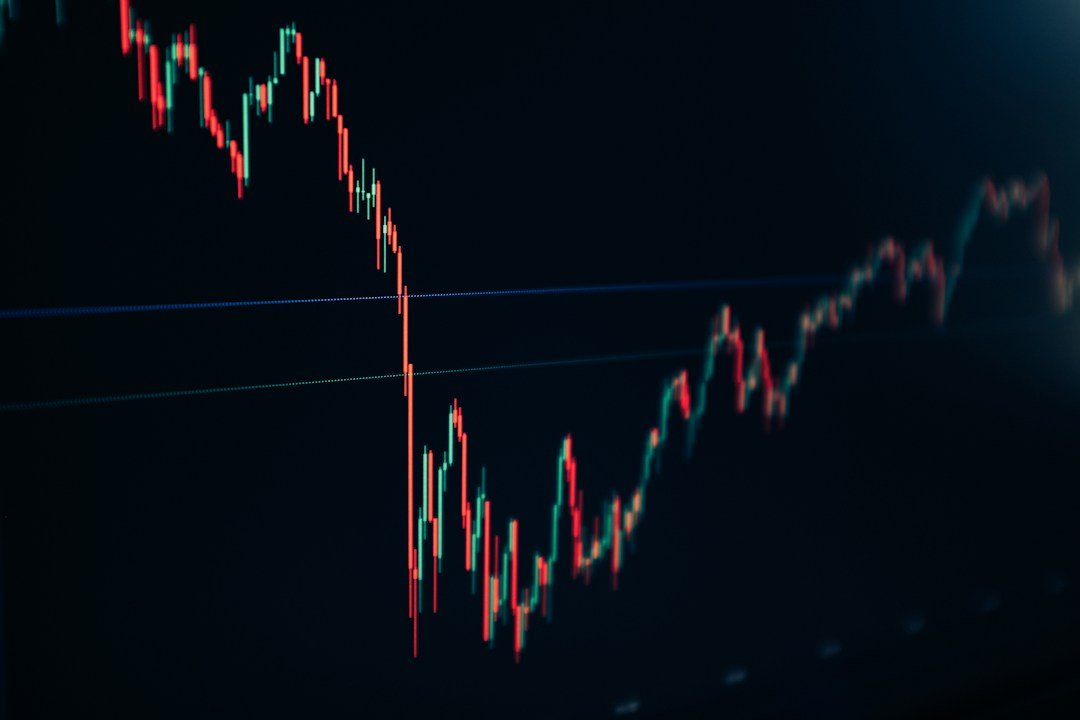
The Nifty is testing important long-term technical levels after one of its longest losing streaks in decades. Here is what the 200-week moving average means and why investors are watching it.
The Indian stock market’s recent decline has pushed the Nifty 50 toward an important long-term technical area, making the 200-week moving average a key level for market watchers.
Technical indicators cannot predict the future, but long-term moving averages are widely followed because they show the broad direction of an index over several years.
What Is the 200-Week Moving Average?
The 200-week moving average calculates the average closing level of an index over roughly 200 weeks, or close to four years. It is therefore much slower-moving than a 20-day or 50-day average.
When an index trades near this level after a major correction, investors often watch it as a potential area of long-term support.
Why Is It Important Now?
The Nifty has suffered an unusually long losing streak, with reports describing eight consecutive weekly declines — its longest such run in 25 years. citeturn0search4
That makes the current technical structure important. A sustained hold above major long-term support could encourage buyers, while a decisive break could increase concerns about a deeper correction.
Technical Support Is Not a Guarantee
A moving average should not be treated as a guaranteed floor. Markets can move through technical levels when fundamental conditions deteriorate sharply.
Current macro risks include high crude prices, foreign selling, a weaker rupee and tighter monetary policy. These factors can overwhelm technical support if investor confidence falls significantly.
What Other Levels Are Traders Watching?
Market analysts have recently highlighted the 22,400–22,200 region as an important near-term support area, with 22,182 — the April 2026 low — another level to watch. A move back above 23,000–23,100 would improve the short-term technical picture. citeturn0search2
What Could Strengthen the Market?
- Improving foreign flows
- Lower crude prices
- Falling global bond yields
- Stable rupee
- Strong corporate earnings
- A less restrictive RBI outlook
What Could Break Support?
A combination of persistent oil inflation, further foreign selling, disappointing earnings and rising global yields would increase the probability of a deeper market correction.
Bottom Line
The 200-week moving average is useful as a reference point, not as a buy-or-sell signal. Investors should combine technical levels with earnings, valuations, economic data and global conditions.
For MarketNex readers, the key message is simple: the Nifty is entering an area where long-term investors will be watching closely, but confirmation from fundamentals remains essential.
Sources
- India Today, October 7, 2026.
- Economic Times, October 7, 2026.
- NDTV Profit, October 7, 2026.
Related Reading